
Introduction
A stationary process is a fundamental concept in time series analysis and is essential for forecasting and statistical modelling of financial data used for certain types of quantitative algorithmic trading strategies. "Pair Trading" is one such quantitative trading strategy that is contingent upon the stationarity of the time series formed by a linear combination of the price time series of a pair of financial assets (e.g. stocks, currencies, commodities).
Stationarity being a necessary condition for this strategy, it becomes crucial to check for its existence in any potential candidate pair of assets. In case such a linear combination of the two asset prices exhibits stationarity, the two assets are said to be “Cointegrated”, that is, they form a “Cointegrated Pair”. Such pairs are candidates for inclusion in Pair Trading strategy, subject to some additional conditions.
The Python "stattools" library has functions for testing stationarity of a time series as well as cointegration.
- The "adfuller" function implements the Augmented Dickey-Fuller (ADF) Test which forms the second step of the Engle-Granger Two-Step Cointegration Test.
- The "coint" function directly tests for the cointegration between the price time series of any given pair of assets.
A) adfuller function (Augmented Dickey-Fuller Test)
The adfuller() function is meant for checking if a single time series is mean-reverting or not. For instance, checking a time series for mean reversion before applying an ARIMA model on it.
- Used to test for stationarity in a single time series.
- Null hypothesis (H0): The time series has a unit root (i.e., it is non-stationary).
- Alternative hypothesis (H1): The time series is stationary.
- If the p-value is low (typically < 0.05), we reject H0, meaning the series is stationary.
- If the p-value is high, we fail to reject H1, meaning the series is likely non-stationary.
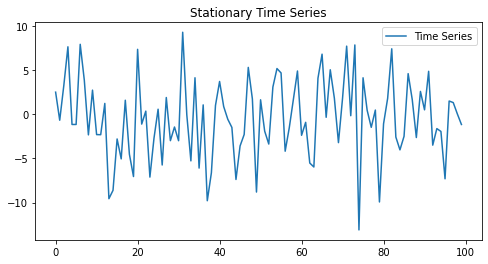
ADF Statistic: -10.0844
P-value: 1.165 * 10-17
Download python code
B) coint function (Cointegration Test)
The coint() function is meant for checking if two time series move together over time or not. This property is used in devising a type of market neutral meant reversion trading strategy known as Pair Trading.
- Used to test for cointegration between two time series.
- Null hypothesis (H₀): The two time series are not cointegrated (they do not share a common stochastic trend).
- Alternative hypothesis (H₁): The two time series are cointegrated (they move together in the long run).
- If the p-value is low (typically < 0.05), we reject H₀, meaning the series are cointegrated.
- If the p-value is high, we fail to reject H₀, meaning the series are likely not cointegrated.
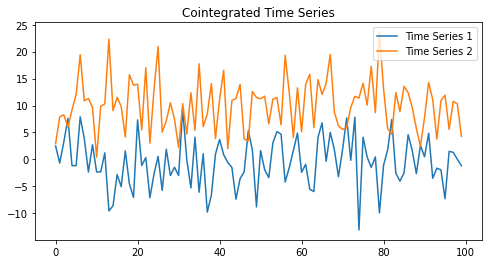
Cointegration Test Score: -10.3495
P-value: 3.297 * 10-17
Download python code
Engle-Granger Two-Step Test for Cointegration
The Engle-Granger Two-Step Test is a method for testing cointegration between two time series. It is widely used in pair trading to identify asset pairs that move together in the long run. It involves using an Ordinary Least Squares (OLS) regression and the Augmented Dickey-Fuller (ADF) test.
Steps:
- Run an OLS regression of one asset on another to get the hedge ratio.
- Calculate the spread using the hedge ratio.
- Run the ADF test on the spread to check for stationarity.
- If the spread is stationary, the two assets are likely cointegrated, meaning they revert to a mean over time.
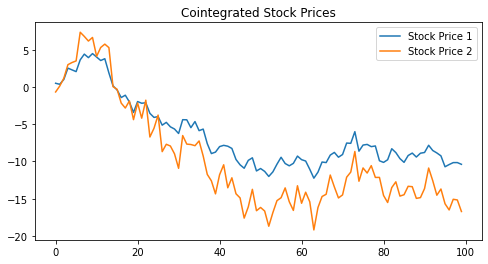
Hedge Ratio: 1.4983128084959811
ADF Statistic: -10.8724
P-value: 1.357 * 10-19
Download python code
Key Considerations:
- If two assets are cointegrated, they move together in a stable relationship over time.
- The OLS regression finds the best hedge ratio to model this relationship.
- The spread (y - hedge_ratio * x) should be stationary if the pair is cointegrated.
- The ADF test checks for stationarity—if the spread is stationary, the pair is cointegrated.
Manual Engle-Granger Two-Step Cointegration Test vs. coint function
The p-value differs between using coint function and manually running the Engle-Granger Two-Step Cointegration Test (OLS regression + adfuller) because of the way coint function handles critical values and finite sample adjustments.
Key differences in how coint and adfuller compute the p-value
1) coint uses precomputed critical values for cointegration tests- The coint function does not use the standard Augmented Dickey-Fuller (ADF) test critical values.
- Instead, it uses Engle-Granger cointegration test critical values, which were derived through Monte Carlo simulations.
- These critical values account for the dependency between y and x in the OLS regression.
- The ADF test (adfuller) assumes the time series follows a standard Dickey-Fuller process.
- However, in the Engle-Granger cointegration test, the residuals time series comes from an OLS regression and hence are supposed to follow a normal distribution.
- So this causes a difference in the distribution of the data that the ADF test expects and the distrubtion of the data that is fed to it from the OLS regression residuals. This introduces bias.
- The coint function applies an adjustment for small sample sizes, making the p-value more accurate.
- When manually running adfuller, we assume the residuals are purely stochastic.
- In reality, the OLS residuals are not a true random walk but a transformation of the original data.
- The coint function accounts for this by adjusting the p-values and critical values.
- The coint function allows you to specify a trend component (e.g., constant, linear trend), affecting the p-value.
- The manual Engle-Granger two-step ADF test does not automatically include this, potentially causing different results.
Manual Engle-Granger ADF test statistic: -10.87243
coint function test statistic: -10.92564
Manual Engle-Granger ADF p-value: 1.3577 * 10-19
coint function p-value: 1.2605 * 10 -18
coint function critical values: [-4.01048603, -3.39854434, -3.08756793]
Download python code
Why These Differences Matter in Pair Trading
- Running the manual Engle-Granger two-step ADF test and using the adfuller function, might underestimate or overestimate cointegration due to incorrect critical values.
- The coint function gives a more robust p-value, making it the preferred method for statistical arbitrage and pair trading.
Summary
Conclusion
For the purpose of find cointegrated pairs of assets for Pair Trading, it is better to use the coint function, instead of manually running the Engle-Granger two-step ADF test and using the adfuller function, beause the coint function gives more accurate and robust p-values and hence better estimates of cointegration.